 |
|
|
|
|
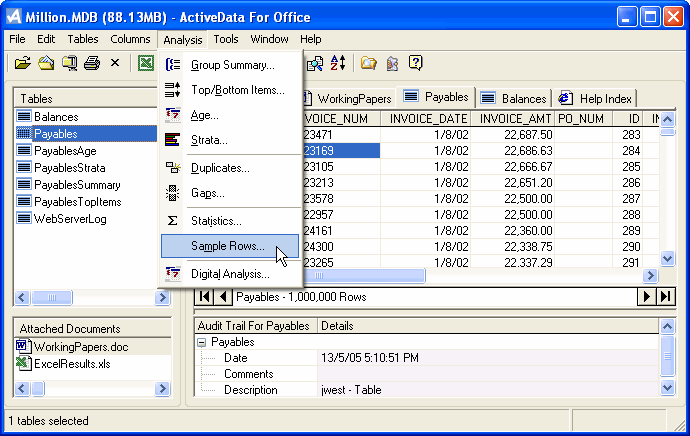
Group Summary
Summarize your data, by up to three groups, in ascending or descending order.
Top/Bottom Items
Select the top/bottom number of items from each group of rows.
Age
Take your dated information and group and total it according to intervals you set.
Strata
Takes your data and splits it into bands that you define. Get the totals and stats
you need by the data groupings you want and then chart if desired.
Duplicates
Find duplicates in your data. Once you have them identified you can remove them,
put them into a new table.
Gaps
Specify a range in a column or group and then look for items that spill over and
move them to a table.
Statistics
Select columns, and get totals, averages, standard deviations, variances, maxs,
and mins.
Sample Rows
Randomly sample a specified number of rows (records). Includes Monetary Unit (PPS
- Probability Proportional to Size) sampling.
Digital Analysis
Use Benford's Law to perform digital analysis tests on your data to detect variances
and fraud

The Tables Menu
The Columns Menu
The Analysis Menu
The Tools Menu
The Import Menu
The Document Menu
Other
Special! Free Choice of Complete Excel Training Course OR Excel Add-ins Collection on all purchases totaling over $70.00. ALL purchases totaling over $150.00 gets you BOTH! Purchases MUST be made via this site, or by following THIS LINK Send payment proof to [email protected] 31 days after purchase date.
Instant Download and Money Back Guarantee on Most Software
Excel Trader Package Technical Analysis in Excel With $139.00 of FREE software!
Microsoft � and Microsoft Excel � are registered trademarks of Microsoft Corporation. OzGrid is in no way associated with Microsoft