|
|
| Buy Today (below) and send us your order ID and claim over $70.00 worth of FREE software |
|---|
back-testing Excel, part of Trader Excel Package , is an add-in for back-testing trading strategies in Microsoft Excel. It enables you to test and evaluate end-of-day trading strategies using historical data. Users can use VBA (Visual Basic for Applications) to build strategies for Back Testing Excel. However, VBA knowledge is optional - in addition to using VBA-constructed trading rules, you can construct trading rules on a spreadsheet using standard pre-made back-testing codes.
Back Testing Excel supports advanced functionality, such as pyramiding (change of position size during an open trade), short/long position limiting, commission calculation, equity tracking, out-of-money controlling, buy/sell price customizing (you can trade at Today's or Tomorrow's Open, Close, High or Low prices). Such functionality enables you to build "natural" trading strategies and prevents you from putting your strategies in "frames."
Back Testing Excel creates informative and highly detailed strategy test performance reports. Each report has seven tabs:
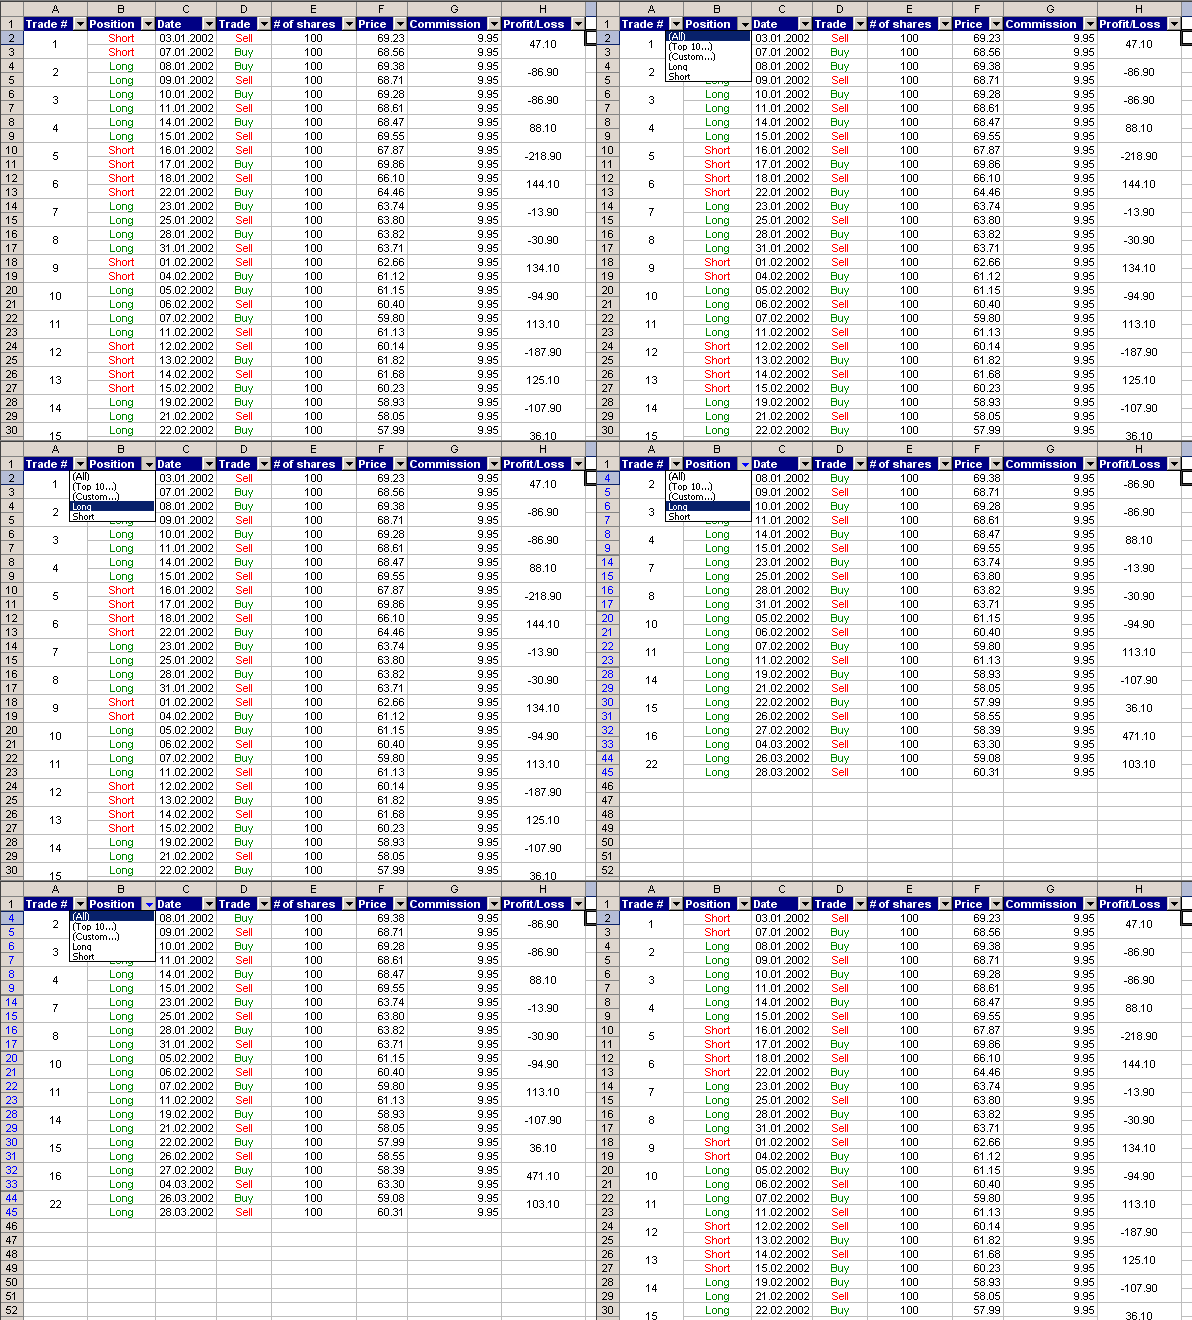
The Trades, Trades (chronological) and Signals reports have an AutoFiltering option that, when implemented, can produce more refined reports. Filtering is a quick and easy way to find and work with a subset of data in a list. A filtered list displays only the rows that meet the criteria you specify for a column. Unlike sorting, filtering does not rearrange a list. Instead, it temporarily hides rows you do not want displayed. When you activate AutoFilter, arrows appear to the right of the column labels in the filtered list. AutoFilter can be used, for example, to display just short trades, profitable trades, or trades executed after some specified date, or just those signals that resulted in trades.

To backtest a trading strategy, Back Testing Excel iterates through all rows of historical data, executing strategy code for each row of data. Strategy code consists of these basic building blocks:
| Function | Action | Syntax |
|---|---|---|
| DT | Returns Date | DT(Day) |
| OP | Returns Opening Price | OP(Day) |
| HI | Returns High Price | HI(Day) |
| LO | Returns Low Price | LO(Day) |
| CL | Returns Closing Price | CL(Day) |
| VOL | Returns Volume | VOL(Day) |
| OI | Returns Open Interest | OI(Day) |
| RNG | Returns Range Value | RNG(UpperCell, Day) |
| Buy | Creates Buy Signal | Buy(NumberOfShares, SpecialOrder) |
| Sell | Creates Sell Signal | Sell(NumberOfShares, SpecialOrder) |
There are two ways to create strategies:
Here is an example of a trading rule: Sell if Today's Open is greater than Today's Close, otherwise Buy. We can realize this rule in two ways:

As you can see, the rule '=IF(B2>E2;"Sell";"Buy")' is located in each cell and produces buy/sell signals.

Back Testing Excel code generated for this strategy can be re-used to produce buy/sell signals in other spreadsheets.

There are no rules in the spreadsheet, just historical data.

Trading rules are written using VBA and stored in a special module
|
|
Microsoft � and Microsoft Excel � are registered trademarks of Microsoft Corporation. OzGrid is in no way associated with Microsoft
SPECIALS!
Convert Excel Spreadsheets To Webpages | Trading In Excel | Construction Estimators | Finance Templates & Add-ins Bundle | Code-VBA | Smart-VBA | Print-VBA | Excel Data Manipulation & Analysis | Convert MS Office Applications To...... | Analyzer Excel | Downloader Excel
| MSSQL Migration
Toolkit |
Monte Carlo Add-in |
Excel
Costing Templates